
TL;DR:
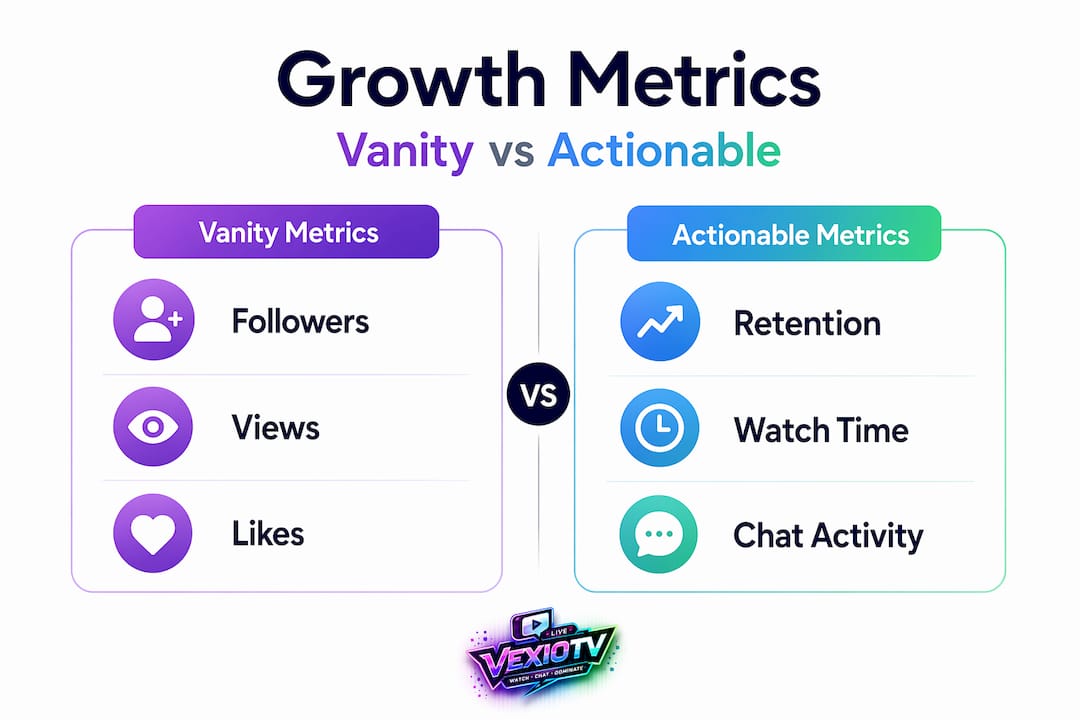
- Follower counts can be misleading because they do not indicate viewer retention, engagement, or returning audiences.
- Streamers should focus on metrics like watch time, retention, chat activity, and discovery surface effectiveness to guide growth.
You can have 10,000 followers and still be invisible to your platform's algorithm. That's the reality many streamers discover too late. Why streamers need analytics goes far deeper than tracking view counts or celebrating follower milestones. The numbers that feel good to watch, like total followers and peak viewers, rarely tell you why people leave after five minutes or which content keeps them glued to the screen. This guide breaks down the metrics that actually drive growth, how to use data to make smarter content decisions, and why analytics are the difference between guessing and growing.
Table of Contents
- Key Takeaways
- Why streamers need analytics beyond vanity metrics
- Using data to make better content decisions
- How analytics connect to platform discovery
- Real-time and historical analytics in action
- My take on data and creative freedom
- Start growing smarter with Vexiotv
- FAQ
Key Takeaways
| Point | Details |
|---|---|
| Follower counts mislead | Raw follower totals don't show retention, chat activity, or whether viewers return to your stream. |
| Retention curves pinpoint problems | Tracking where viewers drop off lets you fix specific content issues instead of changing everything at once. |
| Discovery metrics drive algorithm rewards | Impressions, CTR, and follow-on watch time together determine how platforms surface your content. |
| Real-time data changes live outcomes | Adjusting your stream based on live analytics improves performance in the moment, not just after the fact. |
| Sponsors want engagement proof | Detailed analytics showing watch time and chat activity during branded segments matter far more than follower counts to sponsors. |
Why streamers need analytics beyond vanity metrics
Most streamers start by obsessing over follower counts. That's understandable. Followers are visible, shareable, and feel like proof of progress. But follower totals don't show whether those people still watch, chat, convert, or even remember your channel exists. A channel with 500 engaged viewers who return every stream is worth more, to algorithms and sponsors alike, than one with 5,000 followers who never show up.
The metrics that actually reflect stream health are less obvious but far more useful. Here's what you should track instead:
- Average watch time: How long viewers stay before leaving. Low average watch time signals a weak opening or pacing issues in the first third of your stream.
- 30-second retention: The percentage of viewers who stay past the 30-second mark. This single number tells you whether your stream start is strong enough to hold attention.
- Chat messages per minute: A direct signal of how engaged your audience is. Channels with active chats can outrank higher-viewer channels with inactive chat because platforms treat conversation as a quality signal.
- Clip performance: Which moments viewers clip and share reveals your most compelling content. High clip rates on specific segments show you what to do more of.
- Impressions by surface and CTR: Where your stream gets shown, and how often people click through, tells you which discovery surfaces are working for you.
- Category and time heatmaps: Certain categories, days, and time slots attract more discoverability. Tracking this over weeks shows patterns you'd never notice stream to stream.
The deeper point here is that vanity metrics offer no strategic direction. Knowing you gained 200 followers last month doesn't tell you what caused the gain or how to repeat it. Knowing that your 30-second retention jumped after you changed your stream intro does.
Pro Tip: Set a weekly analytics review of no more than four core metrics. Tracking too many numbers at once creates noise and slows decisions. Start with watch time, chat rate, CTR, and returning viewers, then expand from there.
Using data to make better content decisions
Understanding your metrics is one thing. Using them to improve is where most streamers fall short. The role of analytics in streaming is not just to report what happened. It's to tell you what to do next.
Here's a practical approach to turning data into content decisions:
-
Map your retention curve. Most platforms provide segment-by-segment retention data. Retention curves show viewer leaks by specific moments in your stream, which means you can identify exactly where people leave rather than guessing based on averages. If viewers consistently drop off at the 45-minute mark, that's a structural pacing problem, not a content quality problem.
-
Run controlled A/B tests on stream elements. Change one variable at a time: your opening sequence, your stream title format, the pacing of your first segment. Streamers can run controlled experiments measuring how specific changes affect retention, chat activity, and returning viewers. Two weeks of testing one variable gives you real data to act on.
-
Separate your engagement metrics from sponsor influence. If you run a sponsored segment mid-stream, using separate metric layers for retention and branded clicks prevents false conclusions. A dip in watch time during a sponsor read might look like a content failure when it's actually normal audience behavior.
-
Use timing data to schedule strategically. Your analytics show when your existing audience is most active and when new viewers are most likely to discover your stream. Streaming at your "feel good" time and streaming at your optimal time are often different things.
-
Track returning viewers as a growth signal. New viewers are good. Viewers who come back are better. A rising percentage of returning viewers indicates that your content is building genuine loyalty, not just occasional traffic spikes.
-
Let data reduce guesswork, not replace instinct. Data tells you what happened. Your creative judgment still decides what to try next. The goal is fewer random changes and more deliberate experiments.
Pro Tip: When you notice a retention drop, check whether it correlates with a specific stream segment rather than the overall runtime. Fixing the right five minutes can improve your entire retention curve.
How analytics connect to platform discovery

Platforms reward streams that hold attention and generate interaction. Understanding how analytics improve streaming visibility means looking at discovery data, not just performance data.
The table below shows how key discovery metrics differ in what they measure and what they actually tell you:
| Metric | What it measures | What it tells you |
|---|---|---|
| Impressions | How often your stream is shown to potential viewers | Whether the platform is surfacing your content |
| Click-through rate (CTR) | Percentage of impressions that result in a click | How effective your title, thumbnail, and category are |
| Follow-on watch time | How long viewers stay after clicking | Whether your content delivers on its promise |
| Follow conversion rate | Clicks that result in a new follow | How compelling your stream is to first-time visitors |
The critical insight here is that CTR alone can mislead without watch time context. A 10% CTR sounds strong, but if viewers leave after 90 seconds, the platform reads that as a poor experience and reduces your discoverability. High CTR paired with strong follow-on watch time is the combination that earns algorithm rewards.
Discovery analytics also guide collaboration and packaging decisions. If your impressions spike when you stream in a specific category or with another creator, that's a data signal worth acting on. Small changes in titles or tags can double your CTR and meaningfully change how the algorithm treats your stream. That's the practical reason why tracking platform growth insights matters on a weekly basis, not just at the end of a season.
Real-time and historical analytics in action
Analytics serve two distinct purposes for live streamers: in-the-moment decisions and long-term strategy. Both matter, and they require different ways of looking at your data.
Real-time processing of analytics is crucial for making trustworthy decisions during a live broadcast rather than relying on delayed reports. If your chat rate drops sharply 20 minutes in, you can pivot your content before losing the majority of your audience. If a specific game or topic generates a spike in concurrent viewers, you know to extend that segment. Real-time data gives you the ability to manage audience engagement live, not just analyze it afterward.
Historical analytics serve a different function. They let you benchmark progress and identify trends that aren't visible stream to stream. Consider what historical data reveals:
- Growth rate of returning viewers over 30, 60, and 90-day periods
- Seasonal patterns in your viewership that affect scheduling
- Content performance by category to spot which topics consistently perform above your average
- Watch time trends that show whether your retention is improving month over month
For sponsorships, historical data is what closes deals. Brands want proof of attentive, engaged, and relevant audiences. A sponsor pitch backed by six months of chat density data, average view duration during branded segments, and call-to-action conversion rates is far stronger than one built on follower count alone. Sponsorship metrics focus on attention quality, specifically watch time, engagement during branded segments, and what viewers actually do after a sponsor mention.
The practical tools most streamers use include native platform dashboards for real-time monitoring and third-party analytics platforms for historical trend analysis and cross-platform comparisons. The key is building a habit of reviewing both regularly, not just when something goes wrong.
My take on data and creative freedom
I've worked with enough streamers to recognize the same pattern repeatedly. They hit a plateau, assume the content is the problem, and start changing everything at once. New games, new schedule, new overlay. Nothing improves because nothing was measured.
In my experience, the streamers who grow consistently aren't the most talented ones in the room. They're the ones who treat each stream as a data point. They know their 30-second retention number. They know which content type drives the highest chat rate. They know their best discovery surface. That knowledge doesn't limit their creativity. It focuses it.
What I find most interesting is that many streamers fear analytics will make their content feel mechanical. The opposite is true. When you know your audience stays for your commentary but leaves during extended setup segments, you make a deliberate choice about how to structure your time. That's creative control, not restriction.
The compounding effect of consistent, data-informed decisions is significant. A 10% improvement in retention each month doesn't just mean better numbers. It means the platform pushes your content further, sponsors take you more seriously, and your community grows with less effort because the algorithm is working with you instead of against you.
— M7
Start growing smarter with Vexiotv
If you want to put these analytics principles into practice, you need a platform built for creators who take their growth seriously.
Vexiotv is designed for streamers who want more than just a place to go live. The platform supports community building, real audience engagement tracking, and monetization tools that give you meaningful data to work with. Whether you stream gaming, music, or lifestyle content, Vexiotv gives you the foundation to understand your audience and grow with purpose. Start streaming on Vexiotv and use your data to build something that lasts. Check out the audience engagement guide to see how engagement metrics translate into real channel growth.
FAQ
What analytics should new streamers track first?
Start with average watch time, 30-second retention, and chat messages per minute. These three metrics give you an immediate picture of audience engagement without overwhelming you with data.
Why do follower counts not reflect real streaming growth?
Follower totals don't show whether viewers still watch, chat, or return to your stream. A large follower count with low retention and low chat activity signals an inactive audience, not a growing one.
How do analytics help streamers get sponsored?
Sponsors prioritize engagement quality over reach. Detailed analytics showing watch time, chat density, and viewer behavior during branded segments give you a stronger pitch than follower counts alone.
What is the role of analytics in streaming discovery?
Discovery analytics, including impressions, CTR, and follow-on watch time, show how the platform surfaces your content and whether viewers stick around after clicking. Platforms reward high CTR paired with strong watch time with greater visibility.
How often should streamers review their analytics?
A weekly review of four to six core metrics is enough to spot trends and make informed decisions without creating analysis paralysis. Monthly reviews of historical data help with long-term strategy and content planning.